Summary Metrics and Listings that are Commonly Used to Track Study Progress
The Dashboard Report provides users with study progress-related metrics and illustrative charts. The information becomes even more useful as it can be expanded, drilled into, and exported.
Here is a list of metrics displayed in the Dashboard:
- Site and Subject Enrollment Progress
- Records Entered, missed, and incomplete
- Query counts
- Adverse Events
- Protocol Deviations
- Study Exits
- Review/workflow progress
- Question and Answers
The Dashboard Report is available on both the web browser and mobile app. It will only allow access to data for the site(s) you are a member of.
Prerequisite: Access to the Dashboard Report
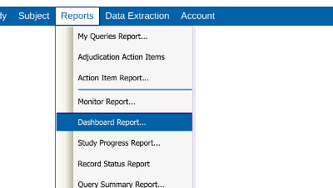
Web Browser:
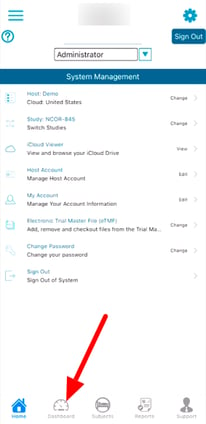
Mobile App:
Once open, select at least one site to see the applicable metrics, as shown below.
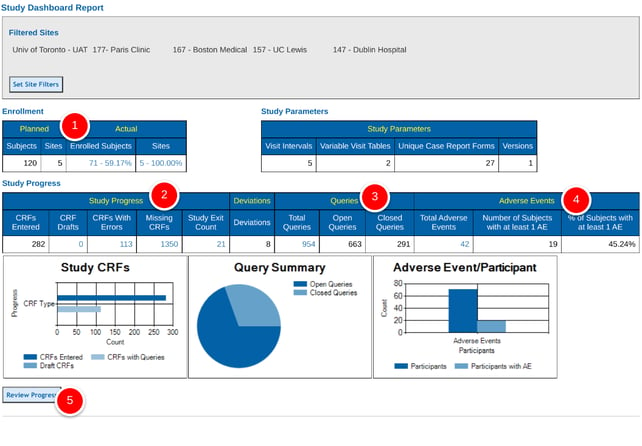
Web Browser: (numbers referenced in the descriptions below)
Mobile App:
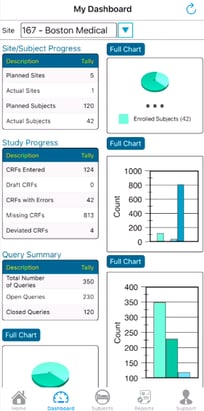
Descriptions of the numbers
1. Site and Subject Enrollment Progress
Planned Subjects and Sites
The total number of planned sites is defined in the study configuration.
The number of subjects planned can come from two different areas, depending on whether the total planned subjects is a total across the entire study or if individual goals are set for each site.
Suppose no value is defined in the study configuration (study-wide goal). In that case, the system uses the per-site goal defined in the site documents (only visible to the Administrative role). In that case, the planned number depends on the sites being filtered in the Dashboard. Suppose a value is defined in the study configuration. In that case, the system will default to displaying that value as the total planned number across the whole study, regardless of which sites are filtered in the dashboard.
Actual Subjects and Sites
The actual number of sites is based on the number of filtered sites.
The actual subjects are dependent on the study configuration. By default, the system counts the number of registered subjects at the current filtered sites. However, if the study configuration has an enrollment variable defined, that is used instead; this way, study builders can define how "enrolled" subjects get counted.
2. Study Progress
CRFs Entered - This displays the total number of CRFs entered, regardless of their statuses.
CRF Drafts - Applicable to studies that allow for saving forms as drafts, this displays the total number of CRFs entered and saved in draft mode. A table below the Review Progress table is displayed if you click this metric. The table displays each CRF and allows you to view the Site, Subject, or CRF by clicking the link and drilling into the subject record.
CRFs with Errors - CRFs with errors or automatic queries and error messages. This is the number of CRFs that contain at least one error. To see a list by Site of those CRFs, click the metric. A CRF Errors table will be displayed below the Review Progress table; you can drill into the form to obtain additional information if you'd like.
Missing CRFs - When scheduled visits are required to be within a subject-specific time range. If a given CRF is not completed within that date range, it is considered “missing.” The number displayed in this table column is the total number of missing CRFs past the visit window. This number can be clicked to produce an exportable list at the bottom of the page. It can also be utilized to click directly into the missing CRFs to complete them.
Deviations - The Deviation form is defined in the Study Configuration application accessed from the Study menu. This metric represents the total number of Deviation forms entered into the system.
Study Exits - This displays the number of subjects with a withdrawal form entered (and saved). Since only one withdrawal form can be entered per subject, the number of withdrawal forms will show how many participant withdrawal forms have been entered (and saved) in the study. The form serving as the withdrawal form is defined in the study configuration workflow under the study menu.
3. Query Summary
This section provides an overall view of the number of queries.
Total Queries - This metric is the total number of existing queries, regardless of the query type or status. It can be tapped to expand a table of the entire query list. This can also be accessed with more details in the Queries Report.
NOTE: The total number displayed will exclude queries not distributed to the viewer's role and queries on fields blinded to the viewer's role.
Open Queries - This metric shows the current number of queries that are still open and await resolution.
Closed Queries - This metric shows the current number of closed queries. Combined with the open queries, this should equal the Total Queries.
4. Adverse Events
Total Adverse Events - This is the total number of Adverse Event forms saved. If the Study Configuration defines a specific variable, it could mean the number of AEs is not necessarily equal to the number of forms entered.
Number of Subjects with at least 1 AE - Similar to the total AEs, but reducing the count down to only count one AE per subject. Also presented as % of Subjects with at least 1 AE
5. Review Progress
The Review Progress table shows the current number of records awaiting or being reviewed at each review level. A study Administrator defines the type and number of review levels.
Tapping on any of the metrics will expand the list of corresponding records. You can then tap the date to drill into each record.
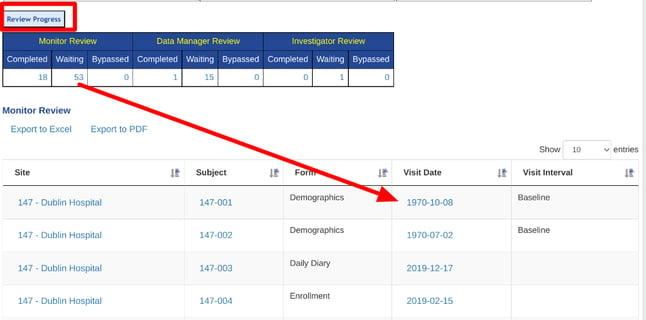
The Action Item Report normally serves as a better tool for conducting review actions. The Dashboard report is intended mainly for viewing progress.
Understanding the Numbers Shown in the Review Progress Table
Ideally, at the end of the study, all records would be counted in the completed column of the last review level. All other columns would read zero. In other words, as the review of records progresses, the count in the completed column will decrease as the next level completes it. However, when a value is clicked to produce a list of those records, the list may contain more than that number. The reason is that all records that have ever had that status will be listed. Also, note that if using the soft review functionality for the first review level, a record may be completed at level one but not yet waiting at level 2. This is because the soft review level allows for open queries, which would need to be closed before the record being kicked to the next review level.
Descriptions of the Charts
With TrialKit web v7.0, the dashboard report charts on the web browser have been enhanced greatly to provide improved visibility of study progress. This section describes each of the charts.
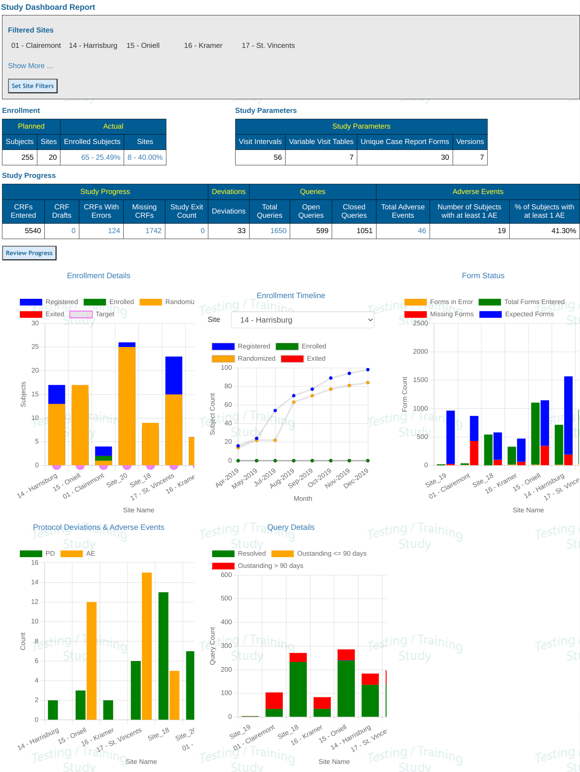
Enrollment Details
Cross-site view of the number of Participants at each site and their primary stage in the study.
- Registered - The number of subjects where a registration form was completed
- Enrolled - The number of subjects where the defined enrollment form was completed
- Randomized - The number of subjects where the defined randomization form was completed
- Exited - The number of subjects where the defined study exit form was completed
- Target - The per-site enrollment goal, if it has been defined for the study
Tap any of the report headers to export the numbers associated with the chart.
Enrollment Timeline
For a given site, the number of enrolled participants over time. This gives a view of enrollment activity at specific time points.
Tap the report header to export the numbers for all sites
Form Status
The status of forms across different sites to indicate data volume and data completeness. Please look at the Site Summary report for additional information about site numbers.
Tap the report header to export the numbers for all sites currently included in the dashboard filter.
Protocol Deviations and Adverse Events
The number of protocol deviations and adverse events occurred at each site. These are based on which forms were defined by the study Builder.
Query Details
The number of queries open and closed at each site. Open queries are broken down into two age categories.
Question and Answers
Q: Is there a master dashboard view of all studies?
A. No, combined study data in a dashboard would be custom work per client