The Data Management Report is a quick method of getting visit and query metrics
The Data Management Report, only available on the web, is a site-specific report of month-to-month data review activities.
Total pages entered (regardless of page status),
Pages monitored,
Pages awaiting monitoring - Any form with a status that precedes the defined Monitoring status
Subject visits/month - This is for the intervals that are selected when configuring the report
Query counts - queries issued by the defined Monitor role and the defined Data Manager role
Total system queries - month-to-month view of how many edit check errors were generated across all forms when the forms were saved.
It produces an output in Excel and one displayed on the screen:

Tip
Another helpful report displaying similar information, broken down by site is the Site Summary.
Accessing and Configuring the Data Management Report
The Data Management Report is accessed under the Report menu on the web. After opening, define the report parameters as described below.
.png)
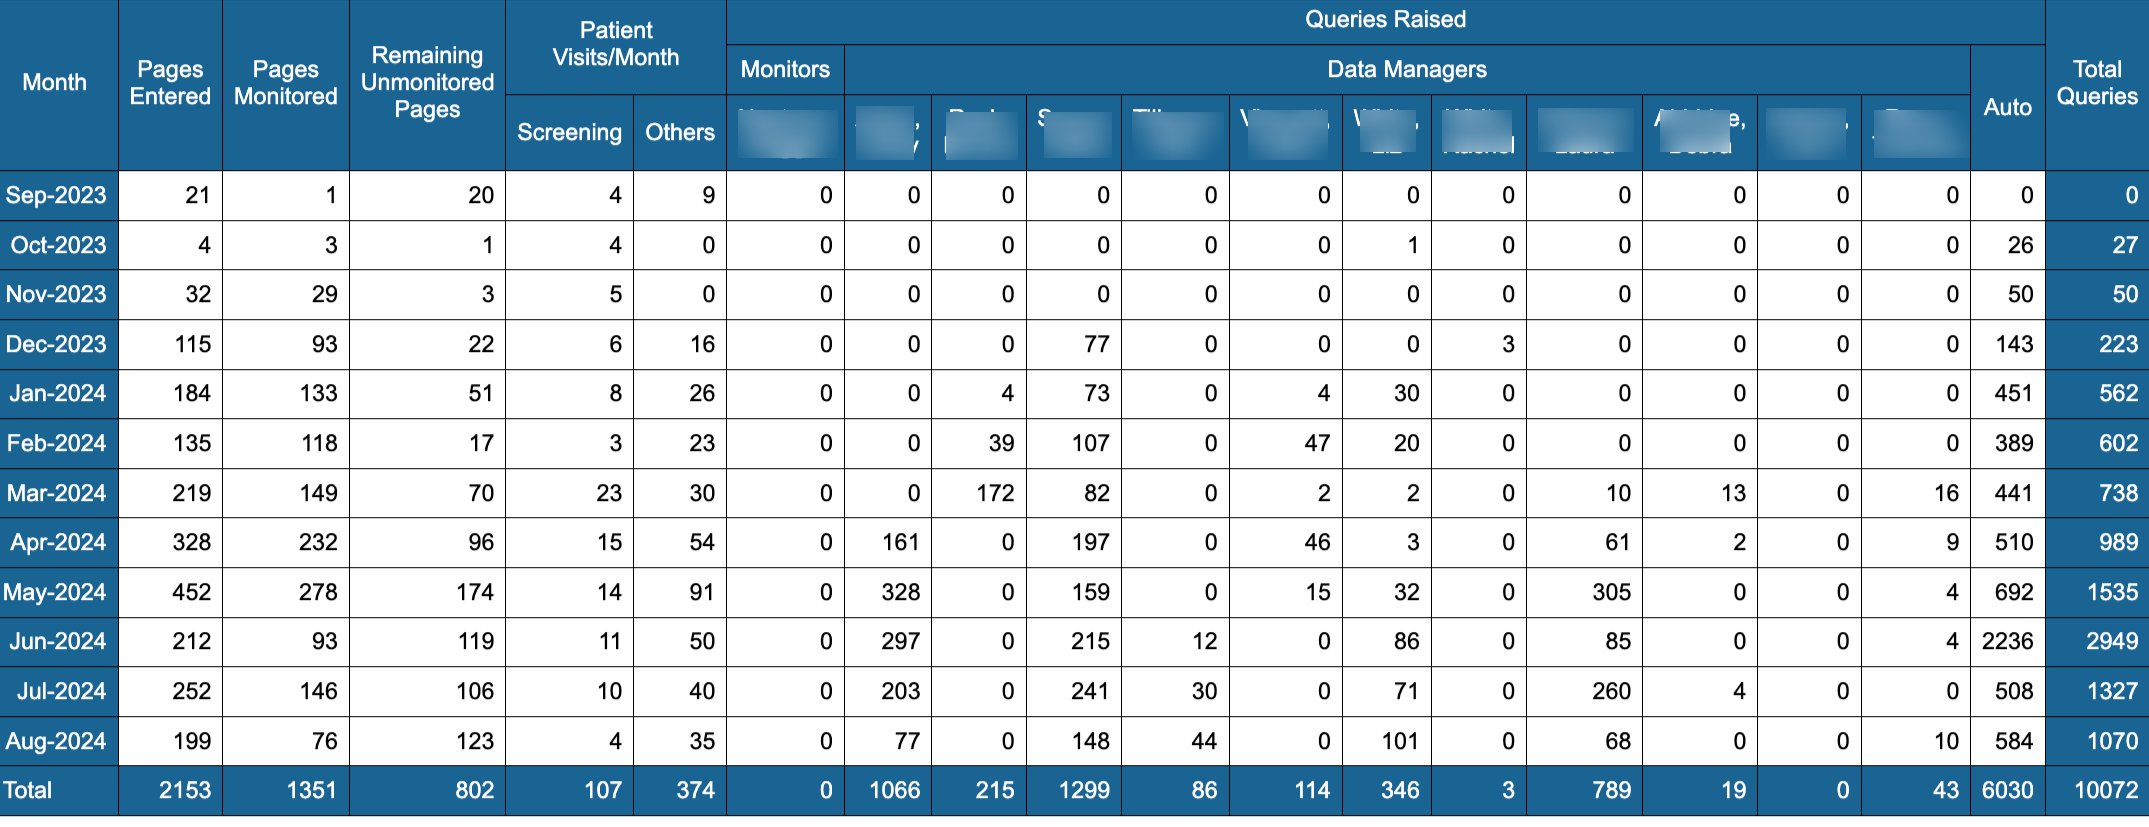
Month: Range from steps three and four above
Pages Entered: Pages entered for that time frame in subject forms
Pages Monitored: Pages monitored for time-frame defined
Remaining Unmonitored Pages: Total number of remaining pages to be monitored.
Patient Visits/Month - This column represents the "Main Visit" selected from the drop-down in step five above. The number equals the number of unique visits subjects have had in that interval. The example below is named "baseline" and shows how many baseline visits as a whole were recorded during that time frame.
Other Visits: Total count of unique visits(intervals) in the "Other Visits" selected. All extra subject visits for visits selected will total all in one number and the grand total for the column. For example, the one below is named "All Other Visits".
Monitors section: List all monitor roles or roles defined in step one above. Total queries raised for each monitor provided by user name for selected visits (intervals) in the report.
Data Managers section: List all data manager roles or roles defined in step two above. Total queries raised for each data manager provided by user name for selected visits (intervals) in the report.
Auto: Total of auto queries (required fields) fired during the time frame defined.
Total Queries: Total raised queries for each row individually and an overall total query raised count.
The report will run in the background and can be accessed from the Background Export Jobs